


DATA SCIENCE
using PYTHON
LIVE ONLINE TRAININGExponential Smoothing
Exponential Smoothing is a rule-of-thumb technique for smoothing time series data, particularly for short-term forecasting. It works by applying exponentially decreasing weights to older observations, ensuring recent data has a stronger influence on the forecast. Unlike simple moving averages, which give equal weight to all observations, exponential smoothing prioritizes recent trends, making it more responsive to real-time changes in data.
Exponential Smoothing is another technique to smooth the time series data to get overall long-term impression of the movements present in the data. As its name suggests, it is exponentially weighted moving averages.
Exponential smoothing is based on three terms,
- Currently observed value at time Yi
- The previously computed exponentially smoothed value Ei and
- The weight or smoothing coefficient assigned.
For the first observation in the series.
- E1 = Y1
- Ei = WYi + (1 – W) Ei-1 i = 2, 3, 4 …
- Ei = Exponentially smooth series at time i
- W = Weight or smoothing coefficient (where 0 < W < 1)
- Ei-1 = Exponentially smooth series at time i-1
This method has below two advantages over Moving Average method.
- We can use it to get the short-term (one period into the future) forecast when it is questionable whether long-term trend is present in the series or not.
- Throughout the series each smoothing calculations is dependent on all previously observed values.(1 – W),Ei-1). Moving average does not consider all observed values.
Forecasting using Exponential Smoothing can be done as follow:
- Ŷi+1 = Ei
- Ŷi+2 = E2000 = WYi-1 + (1 – W) Ŷi-1
For example, we have revenue till 1999 and we want to make forecast for the year 2000 and 2001.
- Ŷ2000 = E1999
- Ŷ2001 = WY2000 + (1 – W) Ŷ2000
The choice of weight (W) is subjective. If you want to smooth the series by eliminating cyclical and irregular patterns, choose weight (W) close to 0. If you want to make the forecast, choose the weight (W) close to 1.
Let’s implement the Exponential Smoothing method using Cabot Corporation revenues using Python.
import numpy as np
import pandas as pd
import matplotlib.pyplot as plt
import seaborn as sns
# Load the input files
cabot = pd.read_excel("./Data/CABOT.xls", sheet_name = "Data")[["Year", "Revenue"]] cabot.head()
| Year | Revenue | |
|---|---|---|
| 0 | 1981 | 1622.8 |
| 1 | 1982 | 1587.7 |
| 2 | 1983 | 1558.0 |
| 3 | 1984 | 1752.5 |
| 4 | 1985 | 1407.5 |
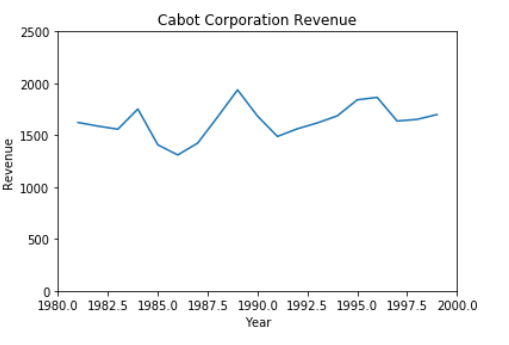
# Plot the Cabot Corp. Revenue
sns.lineplot(x = ("Year", y = "Revenue"), data = cabot)
plt.ylim(0,2500)
plt.xlim(1980,2000)
plt.title("Cabot Corporation Revenue")