


DATA SCIENCE
using PYTHON
LIVE ONLINE TRAININGMoving Average
What is a Moving Average?
A Moving Average is a statistical method used to analyze time series data by calculating averages of different subsets of the complete dataset. The primary objective is to eliminate short-term fluctuations and highlight long-term trends or cycles. Mathematically, a moving average takes the mean of a fixed number of data points and slides forward one data point at a time.
In the vast world of data analysis, identifying trends within a dataset is often crucial for making informed decisions. Whether you're a stock market analyst, data scientist, or business strategist, the Moving Average (MA) is a foundational statistical technique that smooths data to reveal underlying trends. It’s simple to implement, yet powerful in application — making it a go-to method in time series analysis and forecasting.
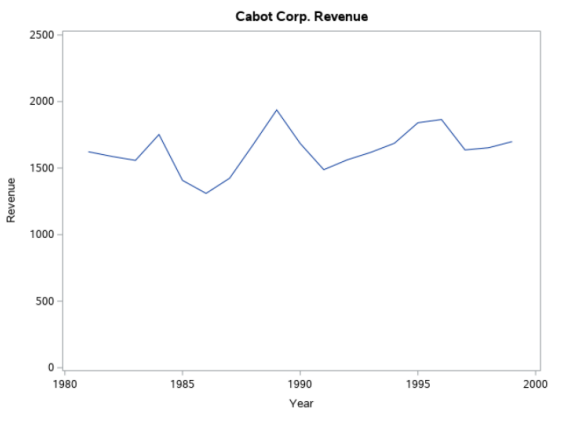
Let us consider the revenue from Cabot Corporation and see how we the Moving Average model can be useful to smooth the annual time series such as below.
By plotting the series, we can identify the factors affecting the movements. In the case of Cabot Corporation revenues, trend movement (long-term upward or downward) is obscured by the amount of variation from year to year.
To obtain the better overall impression of the pattern in the series like above, we need to smooth the series.
Moving Average for a chosen period of length L consist of series of arithmetic means computed over a period of time containing data for length L.
Say we choose L = 3 then
- MA(3) = (Y1 + Y2 + Y3) / 3 for the first three years
- MA(3) = (Y2 + Y3 + Y4) / 3 for the first three years and so on.
Consider following sample data:
- 4.0, 5.0, 7.0, 6.0, 8.0, 9.0, 5.0, 2.0, 3.5, 5.5, 6.5
- MA(3) = (4 + 5 + 7) / 3 = 5.33
- Now, this 5.33 is centered on the middle value – the second value of the series.
- MA(3) = (5 + 7 + 6) / 3 = 6 is centered on the middle value – the third value of the series.
- MA(3) = (7 + 6 + 8) / 3 = 7 is centered on the middle value – the forth value of the series.
and so on.
By doing this, no moving averages can be obtained for first (L-1)/2 year and last (L-1)/2 year. So in our case, first 1 year and last year will be having missing value.
| Data | MA(3) | MA(5) |
|---|---|---|
| 4 | ||
| 5 | 5.33 | |
| 7 | 6 | 6 |
| 6 | 7 | 7 |
| 8 | 7.66 | 7 |
| 9 | 7.33 | 6 |
| 5 | 5.33 | 5.5 |
| 2 | 3.5 | 5 |
| 3.5 | 3.66 | 4.5 |
| 5.5 | 5.16 | |
| 6.5 |
The value of L is highly subjective. If dealing with annual time series data, L should be an odd number. As the L increases, smoothing will also increase but at the same time fewer number of moving averages will be computed.